

All pages

1
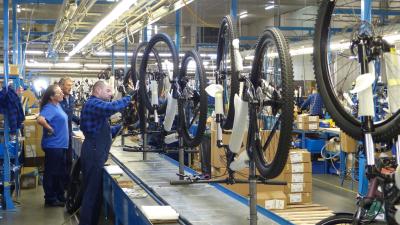
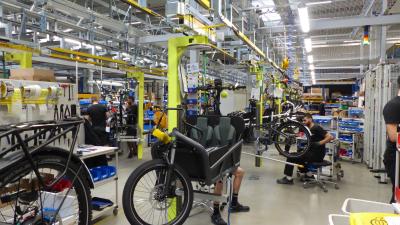
Supply chain grips the industry
Cover and contents
2
Huge increases in lead times
Huge differences in lead-times makes supplies uncontrollable
3
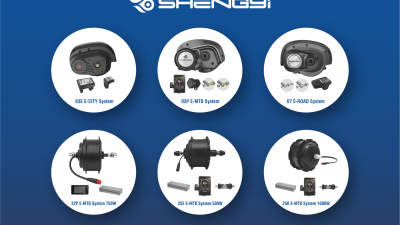
Suzhou Shengyi
Better Choice. Better Riding.

4
Global supply chain index
Global supply chain pressure index at an all-time high

5
Neco
Makes your life better
6
Bicycle industry interviews
Industry insiders reflect on supply chain issues

7
Lishui
The advantages of Lishui’s AIoT System

8
Impact on battery market
An e-bike with no battery?
9
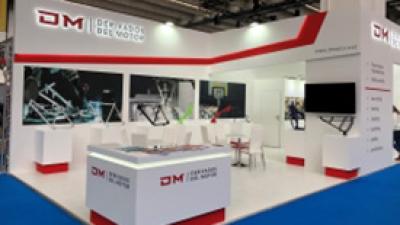
Derivados
Eurobike: consequences two months later

10
Interview Bart Vos
“I don't expect reshoring to become a major trend”
11
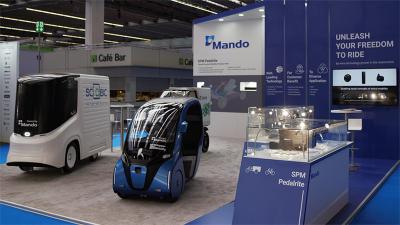
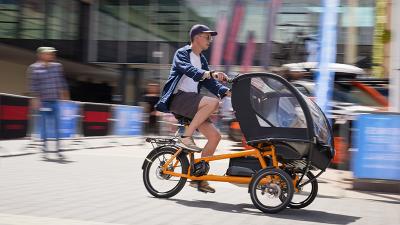
Mando Pedalrite
Mando Pedalrite: A perfect solution for the last mile
12
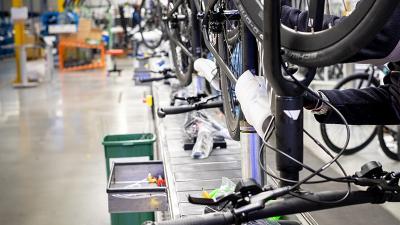
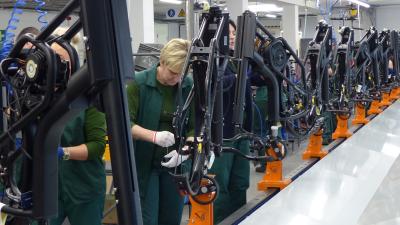
Reshoring production in Europe
Reshoring production in Europe gathers pace
13
DDK Group Co Ltd
High-tech vacuum proces to bond the cover and pad the saddle shell
14
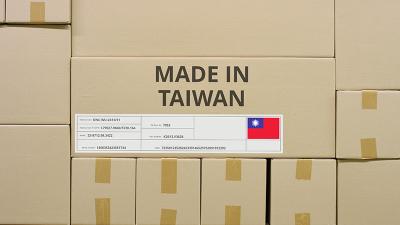
Taiwan exports stats versus EU imports
Boom boosts Taiwan's export revenues

15
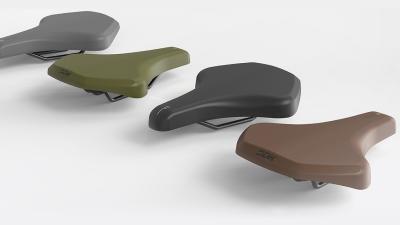
Velo Saddles
Velo introduces atmosfoam using nitrogen process
All editions
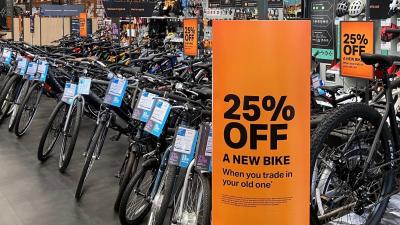
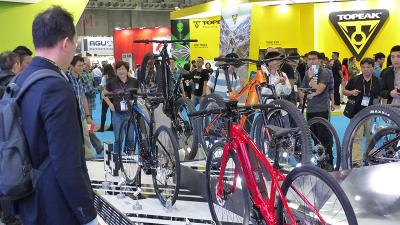
Europe’s bicycle market begins reset
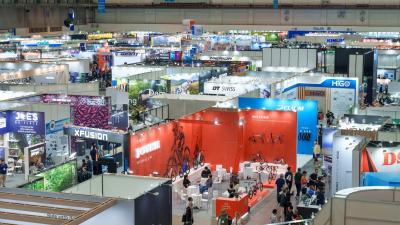
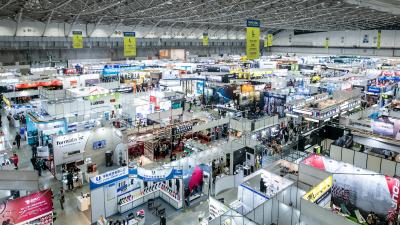
Taipei show tests industry outlook

Cautious optimism in 2026 bike market
Q3 offers no respite for struggling industry

Polands growing stronghold in e-bike production

Navigating market, trade and innovation in 2025
European bike markets show resilience in 2024

Digitilisation driving change in the e-bike market
Central Europe as an e-bike production hub

Securing financial stability in tough market
Indicators point to slow but steady market recovery
2023 challenges European e-bike markets
Will market revival begin in Taiwan?

Can the bicycle industry become greener?
Integration and digitisation transforming product development
Bicycle production steadily converging in Europe
E-bikes bring value to challenged market

E-bikes changing legal landscape
Taipei prepares for bike industry again
Sustainability in the bicycle and e-bike industry
Products & Innovations for MY 2023
Supply chain grips the industry
Eurobike reaffirms strengthening position of e-bikes